
Last week I found out that many WordPress hosts ban many of the most popular plugins from their users. Most of these plugins are Related Posts plugins. I guess they are afraid of excessive database usage. However I myself was interested in this topic as I already made one related posts plugin myself, called Related Posts Lite.
Before you continue, please note, that this is only a server side performance review on one single server. This might differ on any server with different plugins and configurations. In this experiment every plugin is treated equally in terms of layout and usability – thus the review only takes the performance into account, nothing else.
My method
I know, that most of you would say, that I should have used the P3 performance profiler plugin, but it simply felt more exciting to create my own method, which I know it won’t interfere with the results. I made a very simple PHP class, which is inserted into the themes functions.php file. That’s it. It outputs then some basic data to the bottom of the screen in a table format.
You can get the class code here: http://pastebin.com/7vRrGAKp
A few lines of CSS for the exact same table output: http://pastebin.com/sfKnr9rH
Test environment
For the test environment a made a fresh new WordPress install on my local test server and loaded up a few things first.
- I’ve installed a few popular plugins, namely: Akismet, BBPress, Jetpack, WordPress SEO and Shortcodes Ultimate
Why? Simply because most of the WordPress sites use at least 4-5 plugins, so it feels more realistic. - I’ve made 1000+ (1040 precisely) dummy posts. Some with thumbnails and real content. That’s a pretty nice amount to start with.
Initialization
Before anything, I picked a random post and measured the average performance of the server by refreshing the page 20 times.
This average tare performance will be starting point to compare the plugins with. If the class I created is instantiated with the “core” string paramater, it stores the upcoming data as “default”, “tare”, “core” data – thus the environment speed without any further plugins activated. Thus the initialization is the following:
[php]
$o = new measureUsage(‘core’);
[/php]
What’s measured, and how?
The script outputs the:
- Load time – the time the plugin ran
- Memory consumption – the peak memory consumption of the plugin
- PHP ticks – this actually won’t tell much, an approximation of the script length
- Database queries – the number of queries forwarded to the mySql database
However, the most important factor in these tests is the Load time and the number of Database queries. This test however can’t measure the server usage – one needs more powerful tools for that.
Steps of the test:
- Picking a random page
- Activating the plugin to be tested
- Configuring the plugin to show thumbnails and 20 related posts
- Modifying the class code as following:
[php]
$o = new measureUsage(‘some_phrase_which_identifies_the_plugin’);
[/php] - Sampling: Refreshing the picked page 20 times
Why the same page 20 times you ask? It is because I wanted to see how the plugins react to an initial and repetitive page view. I was expecting that some of the plugins will use a cache after the first page view, so the repetitive page views will be faster.
Plugins tested
This test was performed on the following plugins:
- YARPP
- Related Posts Lite (yes, I’m testing my own plugin as well 😉
- Related Posts by Zemanta
- Contextual Related Posts
- Easy Related Posts
- BestWebSoft – Relevant
All of these plugins are FREE and accessible via the wordpress plugin repository. Most of these are banned on many wordpress hosts, let’s se why.
Output
For the output I picked two very important calculations.
- The overall average plugin load time, relative to the core load time
- The average plugin load time after the initial hit (thus after the first page load)
Both values are in per cents, indicating how much of the page load time is taken by the plugins – the lower the better.
Results
Let’s see how the test went. Some results are quite interesting.
Core performance
As I said before, first things first, measure the core performance. After doing the 20 refresh pages I got the following results:
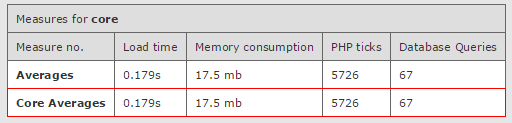
So the average page load is 0.179 seconds, the memory consumption is 17.5 mb roughly and 67 database queries were executed. These values will be subtracted from the ones the program is going to measure with each related posts plugin activated.
Yet Another Related Posts Plugin (YARPP)
This plugin is very very popular. It’s been around for over 4 years now. Let’s take a look at the values.

Evaluation
- Stable, low query count (11) – but since the first pageload has the same query count as the others, it means there is no cache
- Decently low load time and memory consumption
- ~20% average plugin load
- I would rate this plugin STABLE and FAST
- I would recommend it on websites with medium to high bounce rates (lots of unique visitors, less page views)
Related Posts Lite
I will try to be as impartial as I can with my own plugin 😉
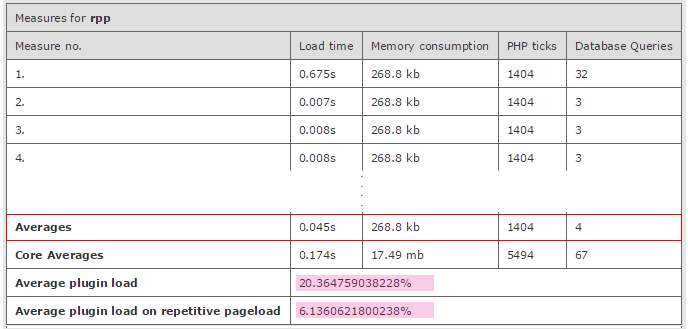
Evaluation
- Very low average query count (4)
- The average plugin load is similar to YARPP (20%), but because of caching the plugin load is ~6.13% on repetitive pageloads
- ..because of that the first hit takes too much time
- The peak memory usage is also lower then YARPP
- I would say the plugin is STABLE, but SLOWER on first page hit, yet EXTREMELY FAST on repetitive page hits
- I would recommend it to websites with very low to medium bounce rates (lots of page views)
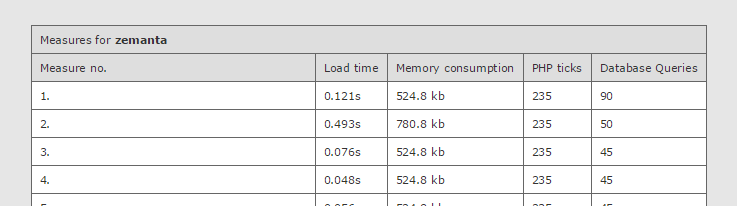
Related Posts (by Zemanta)
This is also a very well known and high rated plugin. Let’s see how it performs.
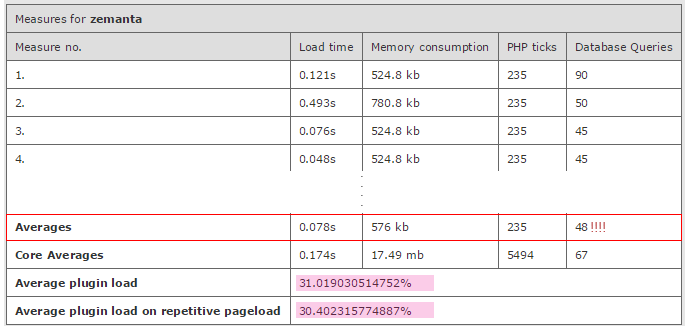
Evaluation
- Very high database query count!! It uses a cache, yet the average query count is ~48
- The load time and the memory consumption is acceptable.
- The plugin load is much higher, than it was with the previous plugins ~31%
- … and it’s not much lower on repetitive page loads either (despite of the caching)
- I would say the plugin is STABLE but it’s SLOWER and uses TOO MANY QUERIES
- I would still recommend using it, but the high number of queries indicates it needs optimizations
Contextual Related Posts
This plugin has surprised me a lot. Well done.
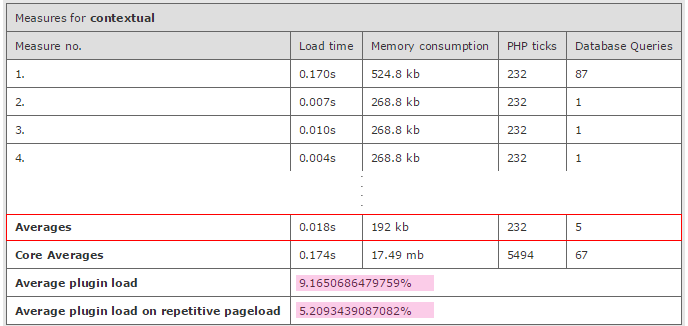
Evaluation
- The initial page load uses 87 queries and it’s a bit slow, but highly acceptable
- Repetitive page loads are extremely fast and only uses ONE query!
- The average plugin load is also extremely low ~9.1%
- ..and the repetitive is even lower ~5.2%
- This plugin looks STABLE and EXTREMELY FAST in almost every situation, well done!
- Highly recommended!
Easy Related Posts
I actually measured this plugin twice, because I though the results were inaccurate, unfortunately not.
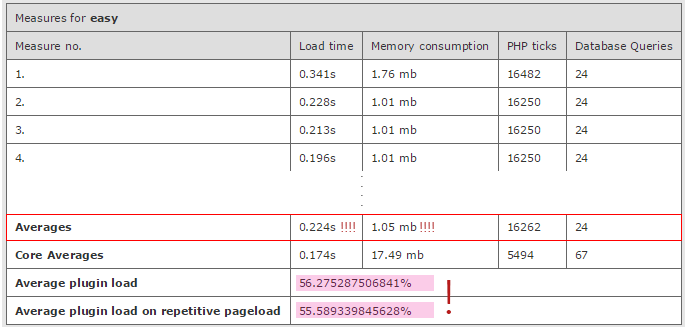
Evaluation
- Very high average load time and high memory consumption
- Very high plugin load percentage ~56.2%
- Definitely no caching implemented
- However the query count is decent
- I would say this plugin is STABLE but VERY SLOW, it needs optimizations
- I would rather recommend using an alternative
BestWebSoft – Relevant
This team has got some nice plugins on the market. Let’s see how they perform.

Evaluation
- Very similar results to YARPP with the ~22% average plugin load
- Acceptable query count, but definitley does not use a cache
- Low memory usage
- I would say this plugin is STABLE and FAST
- I would recommend it
Conclusion
Every plugin was able to handle the test environment one way or the other. For better view, here is a performance chart of the measured values (the lower the numbers, the better):
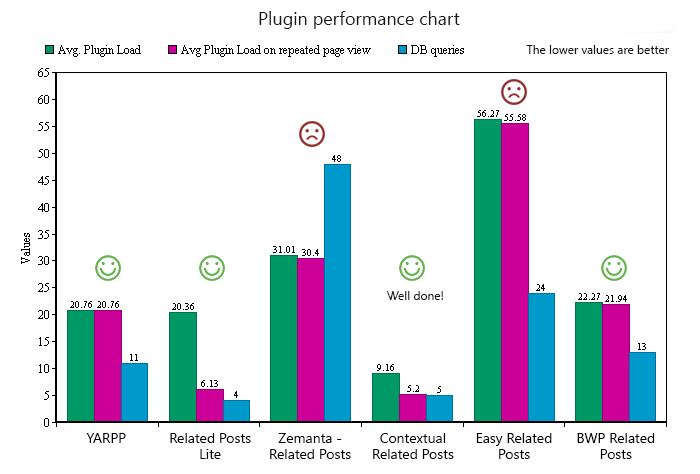
Overall
This is my honest opinion of the plugin performances:
- Best Performance: Contextual Related Posts
- Very Good Performance: YARPP, Related Posts Lite, BWP Related Posts
- Acceptable Performance: Zemanta Related Posts
- Poor Performance: Easy Related Posts
Please note again, that these performances are based on this method. Different test environment and a different method might give you completely different results. This is just an insight based on my method.
Sources and Stuff
- Useful WordPress functions & Resources: WordPress cheatsheet for bloggers
- Performance measuring class: pastebin.com/7vRrGAKp
- Custom table styling: pastebin.com/sfKnr9rH
- Exported content from the test environment: Sample Data
- Charts made by: onlinecharttool.com
- Full measurment data gallery: imgur.com/a/qbLYL